Category Archives: Auckland
Sculpture in the Gardens

Dropping Tipping Point and foundation into a hole we’d prepared earlier.
Auckland Botanic Garden‘s biennial sculpture show is about to open – it runs from 29 November 2015 to 6 March 2016. All of the works are now in place and it looks like a pretty good show with plenty of well-known artists represented. This is the fourth time my work has been selected for this event.
In what has to have been the easiest installation ever, Tipping Point was placed in position way back on 11 November. Toughening OSH rules mean that work on Council-owned land can only be undertaken by appropriately trained and certified contractors and staff. My role was pretty much reduced to watching and offering helpful comments from the sidelines. Overall a great job by the crew.
Tipping Point was crafted in my neighbour’s barn. It did start in my garage, but I quickly worked out that wasn’t going to work.
As with most of my work, there is an environmental message. Tipping points and domino theories allude to points where systems become unstable; producing a cascade of unintended consequences that are as inevitable as the last domino toppling. The work is especially pertinent as our minority National government representatives head off to Paris with proposals for meagre greenhouse gas emission reductions and a disingenuous appeal that the small size of our emissions on a global scale mean that we can maintain business as usual.
This is a position of moral bankruptcy.
Solar Power at Orapiu
It’s now over a year since we installed our solar panels at Red Cottage and it’s a good time to analyse how successful we have been in reducing our power purchases from Mercury Energy.
First to recap, we installed a PV array on our roof in mid-February 2013. It was supplied by What Power Crisis for a total cost of $11,667.85.
Our 9 x 250W panels have a theoretical output of 2.25kW, but because the orientation of our roof is not perfect (the panels face NE), there is a consequent loss in efficiency. As can be seen in the daily production chart (below), the day-to-day variability can be up to 4kWh on either side of the 14 day moving average (red Line). On our worst day in April 2103 we generated only 0.05kWh, but our best day in January 2014 saw 15.57kWh pass through our meter box.

Daily power production from Red Cottage
As there is no power storage on site, any power that we generate over that being consumed is exported to the grid. The purchasing agreement we have with Mercury Energy has them buying power from us at the same rate it is supplied ($0.155/kWh) up to the amount we purchase from them in a given month; any production over and above that quantity is purchased at a discounted rate ($0.035/kWh). Therefore it is more effective for us to use as much of our own power as we can during the day. Energy intensive activities should therefore be undertaken in the middle of the day – a transition that we have not completely adjusted to.
We pay normal consumption levies to Vector Limited and the Electricity Authority on power consumed and daily fixed charges to Vector and Mercury as usual. These extra charges mean that we have never had a monthly power bill that was in credit, but having had the Vector dividend from AECT ($330), paid to our power account we have not had to pay a power bill since September and still are in credit.
Over the year we bought 2,657 kWh from Mercury and sold them 1,882 kWh.
Unsurprisingly, since the panels were installed our power purchases have at least halved in every month – which equates to a saving of $1,167 compared to last year’s power bill. Assuming static power prices, it will take 10 years to pay the system off, but will still have at least another 10 years of life left.
Obviously this is a power strategy that requires high up-front expenditure and a long pay-back period that will not suite most consumers. There is more feel-good factor than budgeting sense in this strategy, but it is a good example of the potential to improve energy efficiency and sustainability on a wider scale. Our location in the Hauraki Gulf means that we get plenty of sunshine and this helps to compensate for the inefficient roof orientation of our system, but for new homes where design can be tailor-made for peak efficiency, this is an option that has much merit.
We would certainly advocate for increasing pressure/incentives by local and state government to encourage uptake of energy efficiency measures – especially for new housing where measures can be optimised.
King Tides – a hint of climate change
There has been significant press coverage of the King Tides experienced around New Zealand last weekend.
Localised surface flooding of low-lying roads in the Auckland region, particularly the Northwestern motorway and Tamaki Drive have been reported with peak tides up to 0.7m above normal. These King tides are produced when a normal monthly Spring tide (at new and full moon) coincides with the closest approach of the moon to earth. The additional gravitational pull on the oceans associated with the coincidence of these events produces both the highest and lowest tides in a year. The peak tide can be intensified by the weather conditions, but in this case most of the country lay under a high pressure ridge that was associated with calm, sunny weather.
As part of an awareness campaign sponsored by Auckland Council, the public were encouraged to photograph King tides around the region and submit them to create a living record of the changes to our coasts and shorelines and a glimpse of what our daily tides may look like in the future as a result of sea level rise. Sea level measured in Auckland Harbour has been rising at a rate of 1.6mm a year over the past century and we are warned to plan for an increase of up to a metre by 2100. This increase is associated with the world-wide melting of glaciers that adds water to the oceans and thermal expansions of the seas as the planet warms. The rise will continue for centuries regardless of any global strategy to combat greenhouse gas emissions.
Under scenarios envisaged by NIWA, the high tides observed around Auckland this weekend will be normal by 2060 and it doesn’t take much imagination to contemplate the impact of future King tides that are up to 0.7m above those experienced this weekend. Adaptation to this reality is staring to filter into planning decisions – regardless of what Bill English and Gerry Brownlee might think about climate change. The New Zealand Transport Agency is about to commence a two-year project to raise the height of the causeway on the Northwestern motorway by 1.5m, and other infrastructure projects must surely be under consideration around the country.
Auckland Council is also starting to pay more than lip service to the concept of climate change. Although the recently adopted Hauraki Gulf Islands District Plan (HGIDP) only contains a single reference to this subject, the newly proposed Auckland Unitary Plan has significantly improved the portrayal of this issue. Planning maps now define areas at risk from inundation i.e. less than 3m above MHWS and now much of the coastal land around Auckland (except on Gulf islands) is included within Natural Hazard zones. New rules associated with these areas will require all development applications be accompanied by a report by a suitably qualified engineer that confirms that the land on which the activity is located is not subject to the following: a. coastal erosion or inundation over a 100 year timeframe. This strategy follows other local bodies around the country that recognise the risk to coastal communities and explicitly warn of potential impacts associated with climate change. After all it would be inappropriate for Councils not to warn of a clear and present danger that could give rise liability at a later date.
The only problem with this planning approach is that adoption of the new Unitary Plan is still several years in the future as the hearings and appeal process will surely significantly delay ratification. Clearly the 10 year cycle of District Plans is too slow and cumbersome to react to risk. Climate change was not on the then Auckland City Council radar when the HGIDP was drafted in 2006, so when the Plan was finally adopted nearly seven years later in 2013, it is in many respects already outdated. It will be another 10 years before the Gulf islands are finally incorporated into the Unitary Plan with its recognition and protections associated with development in at risk coastal zones. The current situation on Waiheke Island sees Resource Consent applications for residential development within the so-called Coastal Protection Yard, where planners and engineers give no consideration to hazards associated with sea level rise and argue they do not have the tools to do so.
While the Resource Management Act clearly states consideration must be given to the effects of climate change in Resource Consent matters, there seems to be a reluctance to integrate this with a Plan that does not address the matter.
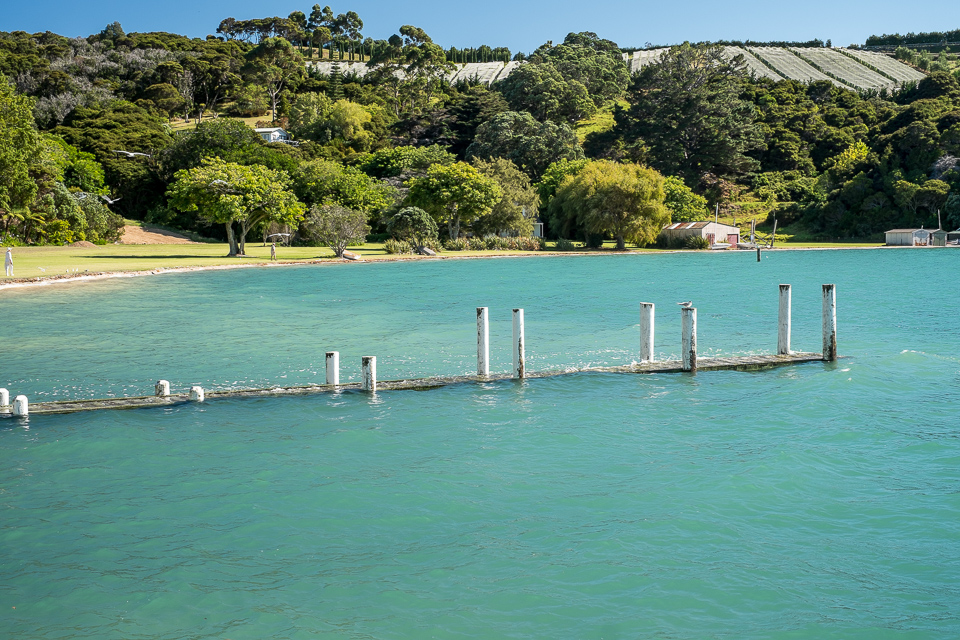 King tide at Orapiu Beach, Waiheke Island: 9:57am on 2nd February 2014. The grassed area currently has a Resource Consent application under consideration for the construction of two houses and sea level rise is not a consideration in this application. Note person on lawn for scale.
Follow Me
