Category Archives: Observations
Solar Power at Orapiu
It’s now over a year since we installed our solar panels at Red Cottage and it’s a good time to analyse how successful we have been in reducing our power purchases from Mercury Energy.
First to recap, we installed a PV array on our roof in mid-February 2013. It was supplied by What Power Crisis for a total cost of $11,667.85.
Our 9 x 250W panels have a theoretical output of 2.25kW, but because the orientation of our roof is not perfect (the panels face NE), there is a consequent loss in efficiency. As can be seen in the daily production chart (below), the day-to-day variability can be up to 4kWh on either side of the 14 day moving average (red Line). On our worst day in April 2103 we generated only 0.05kWh, but our best day in January 2014 saw 15.57kWh pass through our meter box.

Daily power production from Red Cottage
As there is no power storage on site, any power that we generate over that being consumed is exported to the grid. The purchasing agreement we have with Mercury Energy has them buying power from us at the same rate it is supplied ($0.155/kWh) up to the amount we purchase from them in a given month; any production over and above that quantity is purchased at a discounted rate ($0.035/kWh). Therefore it is more effective for us to use as much of our own power as we can during the day. Energy intensive activities should therefore be undertaken in the middle of the day – a transition that we have not completely adjusted to.
We pay normal consumption levies to Vector Limited and the Electricity Authority on power consumed and daily fixed charges to Vector and Mercury as usual. These extra charges mean that we have never had a monthly power bill that was in credit, but having had the Vector dividend from AECT ($330), paid to our power account we have not had to pay a power bill since September and still are in credit.
Over the year we bought 2,657 kWh from Mercury and sold them 1,882 kWh.
Unsurprisingly, since the panels were installed our power purchases have at least halved in every month – which equates to a saving of $1,167 compared to last year’s power bill. Assuming static power prices, it will take 10 years to pay the system off, but will still have at least another 10 years of life left.
Obviously this is a power strategy that requires high up-front expenditure and a long pay-back period that will not suite most consumers. There is more feel-good factor than budgeting sense in this strategy, but it is a good example of the potential to improve energy efficiency and sustainability on a wider scale. Our location in the Hauraki Gulf means that we get plenty of sunshine and this helps to compensate for the inefficient roof orientation of our system, but for new homes where design can be tailor-made for peak efficiency, this is an option that has much merit.
We would certainly advocate for increasing pressure/incentives by local and state government to encourage uptake of energy efficiency measures – especially for new housing where measures can be optimised.
King Tides – a hint of climate change
There has been significant press coverage of the King Tides experienced around New Zealand last weekend.
Localised surface flooding of low-lying roads in the Auckland region, particularly the Northwestern motorway and Tamaki Drive have been reported with peak tides up to 0.7m above normal. These King tides are produced when a normal monthly Spring tide (at new and full moon) coincides with the closest approach of the moon to earth. The additional gravitational pull on the oceans associated with the coincidence of these events produces both the highest and lowest tides in a year. The peak tide can be intensified by the weather conditions, but in this case most of the country lay under a high pressure ridge that was associated with calm, sunny weather.
As part of an awareness campaign sponsored by Auckland Council, the public were encouraged to photograph King tides around the region and submit them to create a living record of the changes to our coasts and shorelines and a glimpse of what our daily tides may look like in the future as a result of sea level rise. Sea level measured in Auckland Harbour has been rising at a rate of 1.6mm a year over the past century and we are warned to plan for an increase of up to a metre by 2100. This increase is associated with the world-wide melting of glaciers that adds water to the oceans and thermal expansions of the seas as the planet warms. The rise will continue for centuries regardless of any global strategy to combat greenhouse gas emissions.
Under scenarios envisaged by NIWA, the high tides observed around Auckland this weekend will be normal by 2060 and it doesn’t take much imagination to contemplate the impact of future King tides that are up to 0.7m above those experienced this weekend. Adaptation to this reality is staring to filter into planning decisions – regardless of what Bill English and Gerry Brownlee might think about climate change. The New Zealand Transport Agency is about to commence a two-year project to raise the height of the causeway on the Northwestern motorway by 1.5m, and other infrastructure projects must surely be under consideration around the country.
Auckland Council is also starting to pay more than lip service to the concept of climate change. Although the recently adopted Hauraki Gulf Islands District Plan (HGIDP) only contains a single reference to this subject, the newly proposed Auckland Unitary Plan has significantly improved the portrayal of this issue. Planning maps now define areas at risk from inundation i.e. less than 3m above MHWS and now much of the coastal land around Auckland (except on Gulf islands) is included within Natural Hazard zones. New rules associated with these areas will require all development applications be accompanied by a report by a suitably qualified engineer that confirms that the land on which the activity is located is not subject to the following: a. coastal erosion or inundation over a 100 year timeframe. This strategy follows other local bodies around the country that recognise the risk to coastal communities and explicitly warn of potential impacts associated with climate change. After all it would be inappropriate for Councils not to warn of a clear and present danger that could give rise liability at a later date.
The only problem with this planning approach is that adoption of the new Unitary Plan is still several years in the future as the hearings and appeal process will surely significantly delay ratification. Clearly the 10 year cycle of District Plans is too slow and cumbersome to react to risk. Climate change was not on the then Auckland City Council radar when the HGIDP was drafted in 2006, so when the Plan was finally adopted nearly seven years later in 2013, it is in many respects already outdated. It will be another 10 years before the Gulf islands are finally incorporated into the Unitary Plan with its recognition and protections associated with development in at risk coastal zones. The current situation on Waiheke Island sees Resource Consent applications for residential development within the so-called Coastal Protection Yard, where planners and engineers give no consideration to hazards associated with sea level rise and argue they do not have the tools to do so.
While the Resource Management Act clearly states consideration must be given to the effects of climate change in Resource Consent matters, there seems to be a reluctance to integrate this with a Plan that does not address the matter.
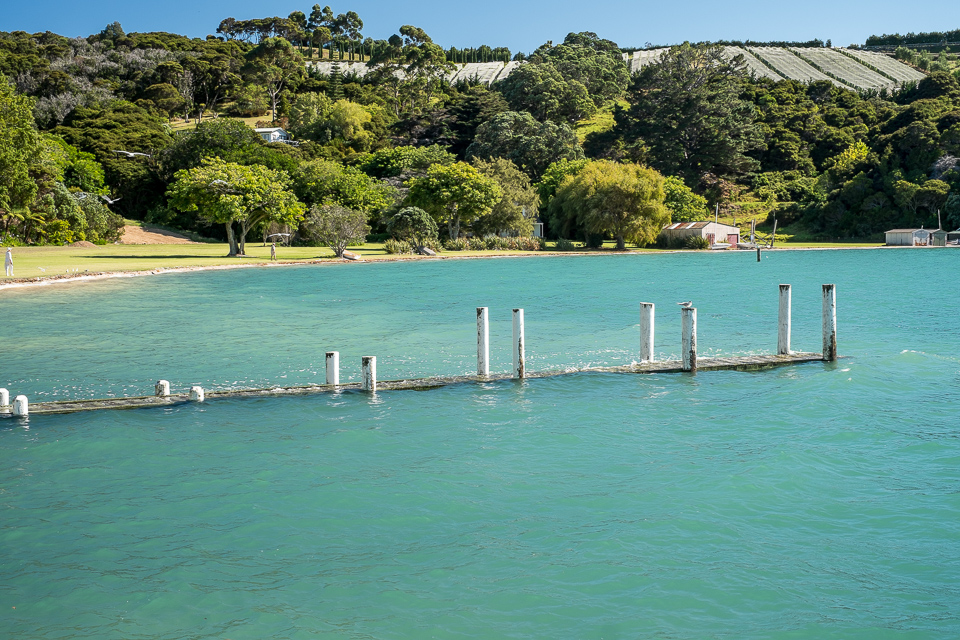 King tide at Orapiu Beach, Waiheke Island: 9:57am on 2nd February 2014. The grassed area currently has a Resource Consent application under consideration for the construction of two houses and sea level rise is not a consideration in this application. Note person on lawn for scale.
The Two States of the Union
The quagmire of U.S. politics has produced a lame duck President who can’t progress policies for which he has a clear democratic mandate. This impasse boils down to fundamental differences between Democrats and Republicans that seem beyond resolution. Drawing on psychological and political research Chris Mooney has discussed this issue in various forums where he argues that core values (e.g. political, ideological, religious) set up a particular framework in the brain that is virtually impervious to facts, logic, and reason. On this basis, consensus is impossible because the two camps can’t recognise what is really going on.
This disjunct is clearly apparent in a recent survey of opinions regarding what should be the top priorities for the U.S. government. While there is a strong bi-partisan consensus that it’s the economy, stupid, there is a clear disconnect between parties as to which areas are most important and should be tackled.

These priorities generally support left-right stereotypes, with Democrats looking to Government for solutions to social problems and the Republicans more concerned about the troops, terrorism and taxes. The biggest gaps between the parties, the environment, distribution of income & wealth and poverty & homelessness are so wide that it seems unlikely there can ever be any political consensus on these issues. On this basis it is reasonable to conclude that it is unlikely that Republicans will ever advance these matters and if they are ever to be addressed, Democrat majorities in the Senate and Congress will be required.
New Zealand’s Ranking on Climate
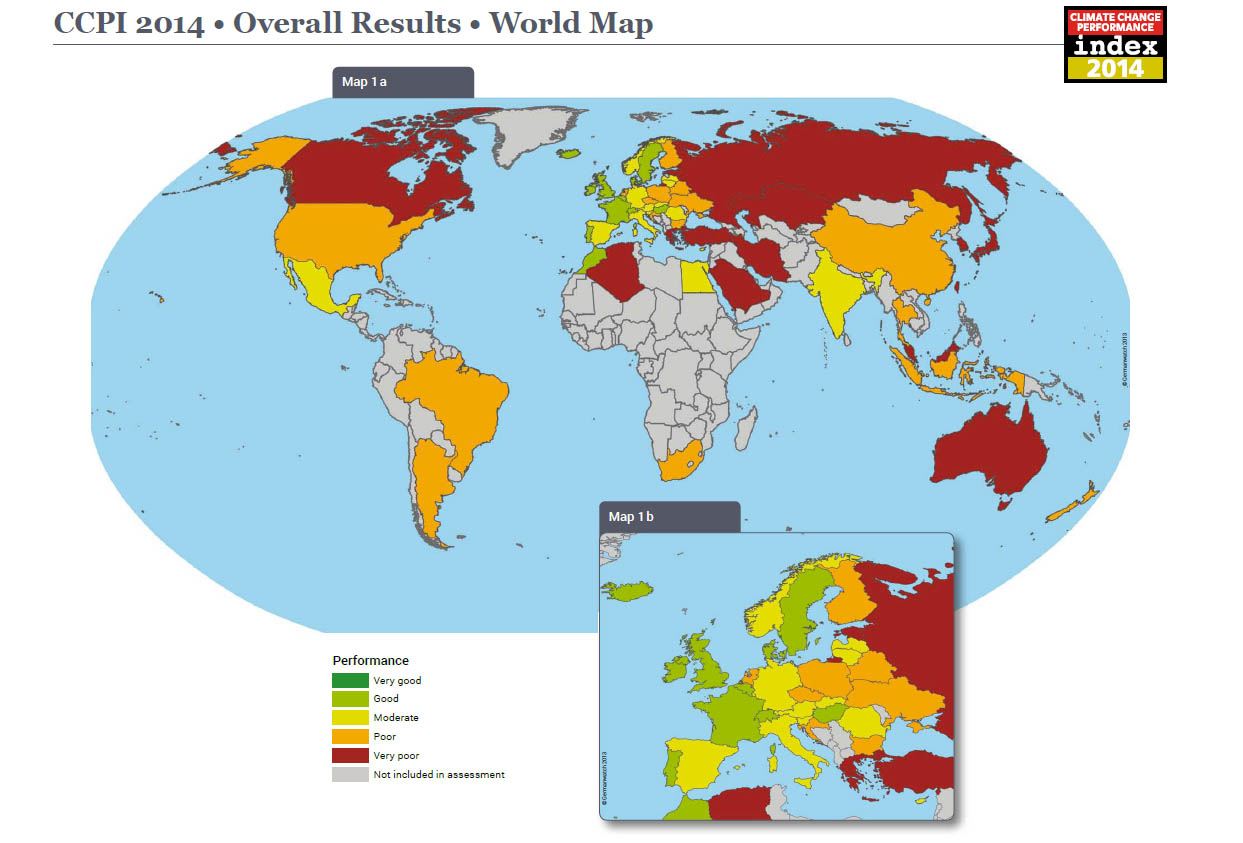
Overall performance of countries in terms of Climate Change Performance Index
Tim Grosser was a bit snippy with reporters when he headed off to the latest round of Climate talks in Warsaw last week. Although government projections have New Zealand’s CO2 emissions continuing to rise for the next decade, he only offered fulsome praise for the reputation of New Zealand in this arena and our overall efforts to reduce emissions.
However, it is no surprise to anyone who is following the path of New Zealand’s minority National government, to learn that other observers are less enthusiastic concerning our efforts.
Germanwatch and Climate Action Network have just released their 7th annual Climate Change Performance Index. The goal of this global survey is to highlight those countries with best-practice climate policies and put political and social pressure on those countries which have, up until now, failed to take ambitious action on climate protection.
They are somewhat hopeful in their overall analysis noting that the rate of increase for global CO2 emissions is declining, but also make the point that no country is doing enough to prevent dangerous climate change. For this reason none is ranked Very Good and the first three positions in their listing are vacant. Denmark tops the list with a score of 75.23 and is followed by United Kingdom (69.66), Portugal (68.38), Sweden (68.10) and Switzerland (66.17). New Zealand (53.49) has retained its Poor rating falling to 42nd place between Argentina (53.60) and United States (52.93). Australia (41.53) also retains its rating (Very Poor), coming 57th out of the 61 countries assessed.
Individual scores are calculated from the assessment of performance in key categories and it is here that New Zealand’s schizophrenic nature is highlighted. We score Good in terms of Development of Emissions and Efficiency, and Moderate in terms of Renewable Energies, but rank among the worst (Very Poor) in terms of Emission Levels and Climate Policy.
The National Party’s hierarchy, stacked with climate sceptics, articulates a first follower policy to climate change i.e when China and United States adopt binding measures, New Zealand will quickly follow. They argue that because New Zealand’s emissions are globally insignificant (0.1%) it would by pointless to act unilaterally.
What they fail to acknowledge is that New Zealand is already in the rump of recalcitrant nations and falls far below the standards of the majority of nations in this survey. Furthermore U.S. emission appear to have plateaued and many individual states in the U.S. are making considerable progress in addressing climate change. Far from first follower, New Zealand is among the worst foot-draggers and the world is beginning to notice.
No Quick Fix for New Zealand’s Economic Woes – Part I
The recent brouhaha regarding the possible contamination of Fonterra milk products has again raised concerns about the lack of diversity in the New Zealand economy. While it is generally acknowledged that primary production underwrites our export economy, it can be surprising to see the full extent of this domination.
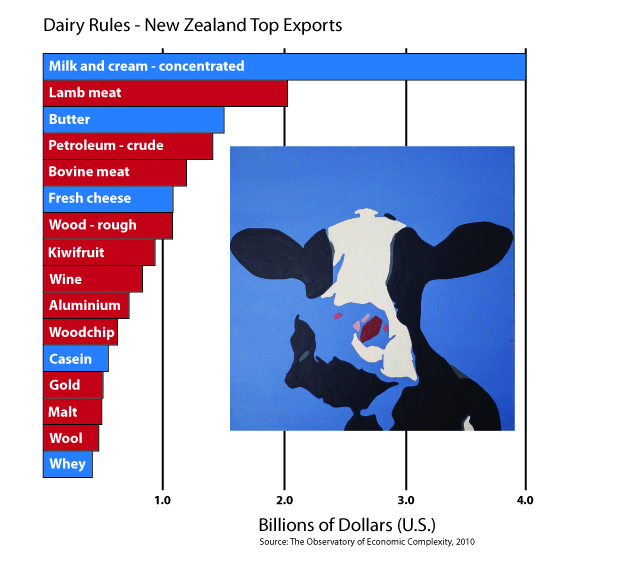
Primary production – particularly dairying dominated exports from New Zealand.
The Guardian Weekly recently queried the durability of the Australian economy because natural resource extraction is so dominant (60% of exports). They argue that the economy has been hollowed out by a resources boom which has driven up the exchange rate making all other exports deeply uncompetitive. Although New Zealand is pretty much in the same boat vis a vis the primary sector, we remain lucky that the demand for primary produce – particularly out of Asia remains strong. But as has been high-lighted by the the dairy scare, this economy is particularly vulnerable to contamination, imported pathogens and invasive pests e.g. varroa mite and PSA.
This relatively limited diversity and complexity of exports from New Zealand influences both the potential of the economy to grow and its resilience. The Economic Complexity Index is an attempt to measure these factors and places New Zealand between Tunisia and Costa Rica at 48th in an analysis of 128 countries . Unsurprisingly in this ranking Japan and Germany head the list, but perhaps echoing the Guardian’s concerns, Australia sits way down in 78th place.
Dairy is likely to consolidate its dominant position in the New Zealand export economy with the OECD predicting dairy conversions to continue through to 2020 with production increasing 2.3% per annum. More than a million dairy cattle have been added to the herd since 2007 (up 23%) at the expense of sheep (down 18.7%), beef cattle (down 15%), deer (down 24%) and pigs (down 14%). There has also been a trend for consolidation of herds with a tripling in average dairy herd size to nearly 400, coincident with a 25% reduction in the number of herds since 1980.
This continuing concentration of exports derived from dairy production further exacerbates the risk to the economy and perhaps explains the fervour of the minority National Government for mineral exploration. Our fourth largest export earner comes from a handful of small oil and gas fields in Taranaki and most of our gold comes from two mines. Thus a mineral discovery or two could significantly improve the bottom line and help diversify the economy.
The $30M the government gave to Rio Tinto to keep their aluminium smelter open for a few more years wasn’t just to bolster the imminent public sale of our largest power producer, but also acts in the short term to maintain our #10 export earner.

Putting a Lid on Terrorism
It seems like only yesterday that George Bush II and his acolytes were leading the willing into Iraq to divest Saddam of the nuclear and chemical weapons that posed an imminent threat to the free world. These weapons – that were never found, were commonly called Weapons of Mass Destruction (WMD) which was the word of the year in 2002. In the Iraq context, WMD implied extremely sophisticated weaponry with the potential for massive killing and destruction.
It is therefore intriguing to see that the surviving suspect for the Boston bombing has been charged  with using WMD. His home-made device comprised components that are all available over the counter in the U.S. (pressure cooker, assorted nails, black powder and a detonator made from remote control toy car parts. The usage of a ‘charged’ term (WMD) in the Boston case appears to reflect a level of outrage rather than an accurate portrayal of the capacity of the bomb. Under the Boston definition, most American homes have the capacity to construct WMD and the logical comparison with Iraq or North Korea is unfortunate.
Black powder, the key propellant in bullets and fireworks is available to firearm enthusiasts who like to make their own ammunition – which is apparently guaranteed by the Second Amendment to the Constitution. However examples of its use in domestic explosives including recreational activities, can be seen in any number of You Tube clips. Although there are apparently some controls on obtaining powder (purchasers over 18 years and ‘limits’ of about 1kg per week), it is easily obtained via mail order or directly from sporting goods outlets.
Contrast this with New Zealand where powder is also available, but can only be purchased by a holder of a Firearms License who also has a Firearm & Ammunition Purchase Form signed by a Police Officer.
In terms of impact, there is little to distinguish the terrorism in Boston from the carnage at Sandy Hook Elementary School perpetrated by Adam Lanza with his Bushmaster rifle. Both actions were apparently undertaken by persons alienated from their community with easy access to weapons and little care for their fellow man. As such any distinction between the WMD (home made bomb) and the semi-automatic (45 rounds per minute) assault rifle with 30 round magazines is semantic – both are equally lethal.
Since the Columbine massacre in 1999, there have been thirty-one school shootings, but the only response by legislators has been a failure to extend the Federal Assault Weapons Ban which expired in 2004. The events at Boston and Sandy Hook were terrorism and their ‘success’ was facilitated by lax gun laws. Perhaps it is time to concentrate some of the War on Terror enthusiasm to controlling the means of undertaking domestic (U.S.) terror attacks be they high school shootings or home-made bombs.
Stagnant weather doesn’t hold back the climate
With Viscount Monckton of Brenchley currently touring New Zealand, I expect many of his adherents – including Federated Farmers, will hear quite a bit about the end of climate change because world temperatures haven’t increased for a decade. This meme is taking hold in all the places that want to latch hold of a headline rather than read the whole article (see post about Rodney Hide below). The Economist has recently posted a short discussion with their ‘Globalisation Editor’ in which he calls for a roll-back of climate measures in light of the mounting evidence.
Why then has the last decade – the warmest on record, not continued to get warmer as record amounts of CO2 are pumped into the atmosphere?
- The historic temperature record doesn’t show a steady year-by-year increase; there is typically a step-wise progression with plateaus followed by sharp jumps i.e a staircase rather than and single slope. A plateau in the temperature record is not in itself surprising.

The staircase to hades.
- The El Nino – La Nina cycle has an impact on global temperatures with El Nino dominated years relatively warm and La Nina years relatively cool. If the recent temperature record is divided into El Nino, La Nina and intermediate years and plotted, each category shows a near identical rise in temperature that has not paused nor shown evidence of decline.

- It is also apparent that man-made forces might be counteracting the expected temperature increases. Recently analysis has implicated pollution through both the input of aerosols into the atmosphere (think Beijing) that reflect incoming energy from the sun and fertilisation of the biosphere via CO2 and nitrogen that promote plant growth and the uptake of CO2. The question is are we prepared endure current levels of pollution to defer temperature rise?
Finally new research has revealed that although the surface temperature record has been static, in fact overall global warming has accelerated with more heat now being taken up by the oceans.
Overall this is a good example of how science works. We make an observation that temperatures have been static for a while and either go yippee the panic is over, or we say that’s funny, everything we know about physics says it should still be warming, what could be the reason? A variety of mechanisms have been proposed that may individually or collectively explain the phenomenon – none offer a reason to relax.
Don Elder was painted into a corner

Trilobite – another fossil.
Everyone from John Campbell to Gareth Hughes has been dumping on Don Elder over the last week. Not only did he oversee the now disastrous diversification of Solid Energy that has been deemed responsible for significant redundancies in the coal mining industry, but he also continues to draw his rather large salary while on gardening leave. John Key has been less than complimentary about the performance of the SOE which Bill English has assured will not be allowed to fail.
Regardless of who was running the show, Solid Energy was certainly facing the prospect of a grim future. Here we had a multi-billion dollar enterprise based on operating coal mines (Waikato, West Coast and Southland) and billions of tons of undeveloped lignite in Southland. As the reality of climate change begins to hit home, it is starting to dawn on even the energy companies, that their share market valuations are based on coal, oil and gas reserves that can never be developed. Current modelling suggests that the listed global Reserves of fossil fuels exceed what can safely be mined by a factor of 5.
We have not yet got to the stage where questions are being asked as to which reserves should not be mined and therefore which companies are grossly overvalued, but we are starting to see some manoeuvring as gas muscles into the power market in the U.S.A. at the expense of coal. The abundance of gas is also a factor in driving down coal prices which is hurting the bottom line at Solid Energy.
This is not the time to have a portfolio chock full of lignite; the dirtiest fossil fuel and perhaps the one most likely to be scratched from the Environment’s dance card. This is where Don Elder comes in. It was almost as if Solid Energy’s diversification strategy was to build up an industry around lignite, as quickly as possible, so that it is too big and too advanced to suffer in any subsequent environmental rationalisation. Hence the dash to develop diesel, fertiliser and briquette industries even though they were heavily criticised by the Parliamentary Commissioner for the Environment in 2010.
It would appear that Don Elder was trying to save his (our) coal company by making Solid Energy too big to fail and thus insulate it from inevitable rationalisations in fossil fuel use. This dinosaur strategy of following short-term profits/lift in company value at the expense of long-term consequences is prevalent in today’s economic growth models. The cynicism of this strategy is exemplified by the lack mitigation measures associated with the lignite projects.
Fortunately this grand gamble was laid low by a strong dollar and low coal prices. Lignite is now off the agenda and the coal mines face downsizing or mothballing. The employment crisis facing the laid off coal miners was always inevitable and the Government’s role should be to facilitate their transition from the industry rather than prop it up through cost-cutting measures such as allowing mining in the Conservation Estate.
Government has us over a barrel
Last year I signed the petition calling for a referendum on the sale of the power companies. Although our minority National Government went to the polls in 2012 saying they wanted to sell, they only scraped past the post; ending up with 59 + 1 (ACT) + 1 (United Future) seats that were for the programme out of the 121 that were available.

Any wind in their sales?
Without getting into the debate over what sorts of margins should be required for governments to pass irreversible legislation, questions regarding the economic merits of selling asset generating an 18% return, when with an extremely strong dollar and low interest rates borrowing is such an attractive option. Especially as the Government intends to spend all of the money raised rather than retire debt.
I’m not an economist, but the fact that they (economists) are arguing among themselves as to the merits of the programme and prices are likely to be depressed by the economic climate all suggest that the sales might not be a smart option. Yet John Key remains locked in to the strategy with a resolve that reflects ideology rather than sense.
So what do I do now?
The sale legislation was passed in Parliament (61 to 60), the High Court challenge has been dismissed and the referendum although likely, will be too late.
Do I buy shares in Mighty River Power – the first cab off the rank in the sale process? Because if I don’t, my allocation could go offshore, or be consolidated within the portfolios of a minority of New Zealanders.
Do I boycott the sale in the rash hope that everyone else does too? Leaving the government with an under-subscribed float and egg on its face.
The answer is I don’t know. My inclination is that I should buy, but it feels wrong. The continued flow of wealth and wealth-generating assets to the few is not an equitable, nor fair solution for the bulk of New Zealand society.
Follow Me
